


Over the years one of the key things that has always set EasyRedir apart from alternative ways of managing redirects has been our redirect analytics. The ability to track redirects – seeing which are performing and which aren’t – can provide extremely valuable data for various areas of an organization. Marketing professionals can use analytics reports for measuring campaign success, sub-brand strength, and taking the pulse of long-standing content. Information Technology can use it for tracking traffic across domains, observing which redirects are getting the most or least traffic across different browsers and being able to make informed decisions accordingly. It’s with this in mind that we reveal some of the exciting work our team has been doing over the last couple of months in leveling up EasyRedir’s analytics!
In-Depth Analysis
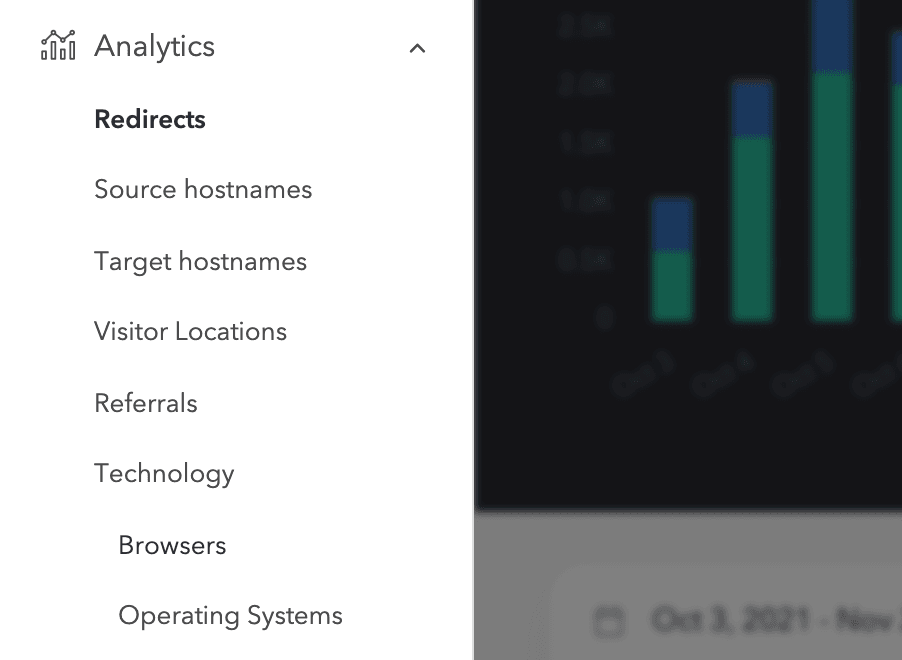
EasyRedir’s newly available detailed analytics offers a deeper and more powerful analysis of your redirects than what was possible before. Drill down even further into your traffic to see each unique request and response by redirect, source and target hostnames. Get a better understanding of the user by having visibility into geographical location, referrer, and technology stack. The enhanced ability to inspect the redirect at various levels drives a ton of value at all levels of your organization.
Intuitive Insights
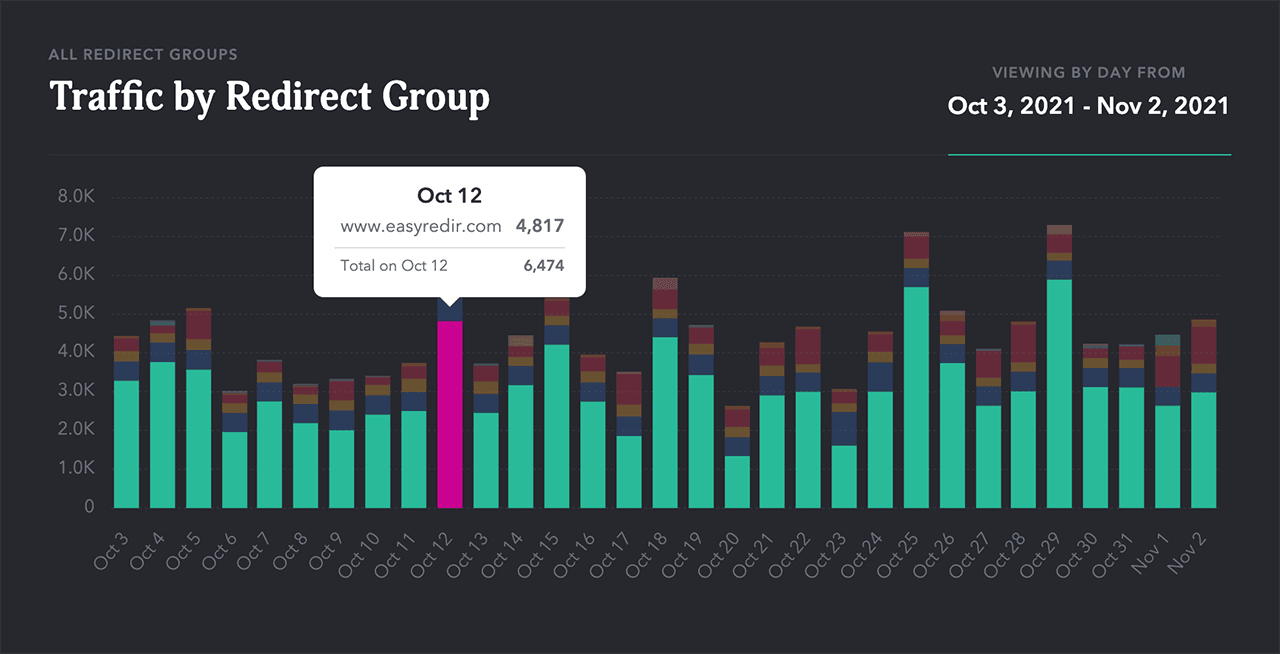
EasyRedir’s detailed redirect traffic analytics quickly delivers insights with little effort by users. The data table includes the ability to select a date range for the report, pagination controls, along with sort order controls. At-a-glance summaries by redirect are prevalent throughout, quickly showing the number of requests each had, whether the request was HTTP or HTTPS, and which response code was returned (e.g. 301, 302, 404). Easy-to-read graphs visually display the information to help illustrate trends and allow the user to hover over each segment to get further details.
Adjustable Date Ranges
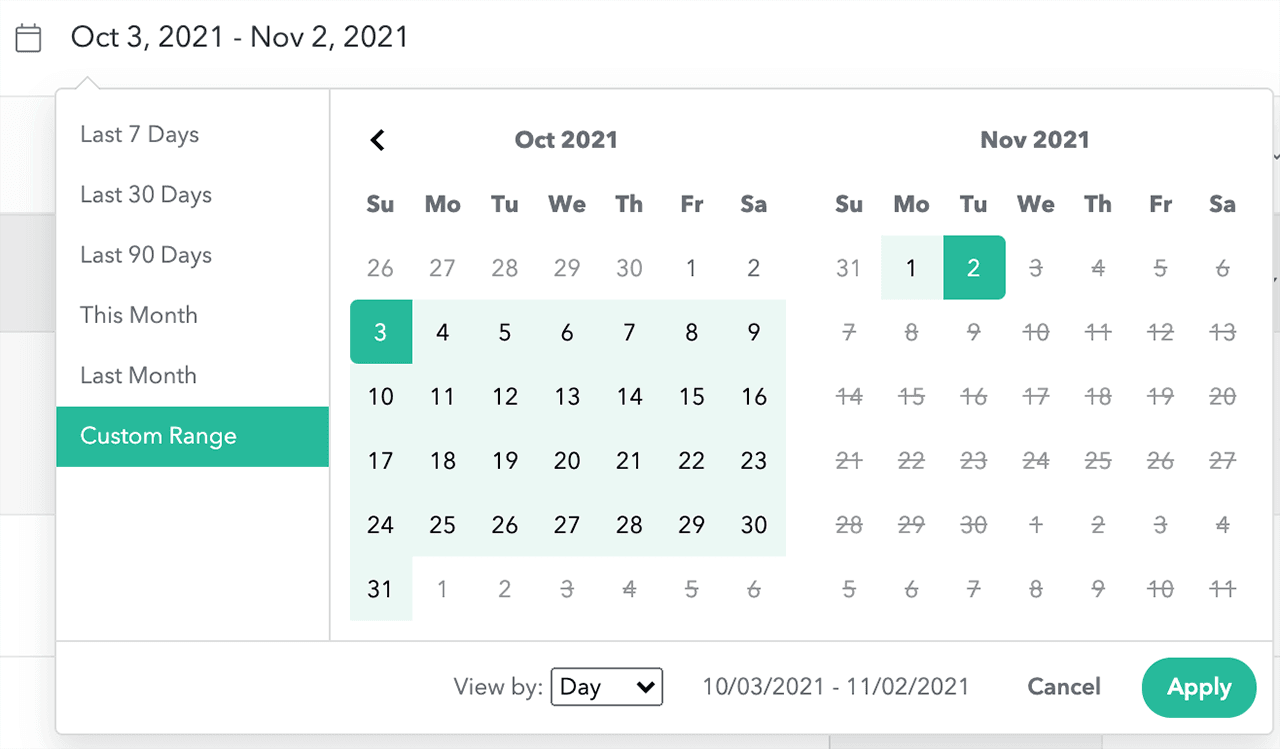
Want to see how a campaign has performed over the last 6 weeks or the uptake on a new domain over the last few months? The ability to segment your query over a specific time period allows for deeper understanding and a better user experience.
Easily Take Action!
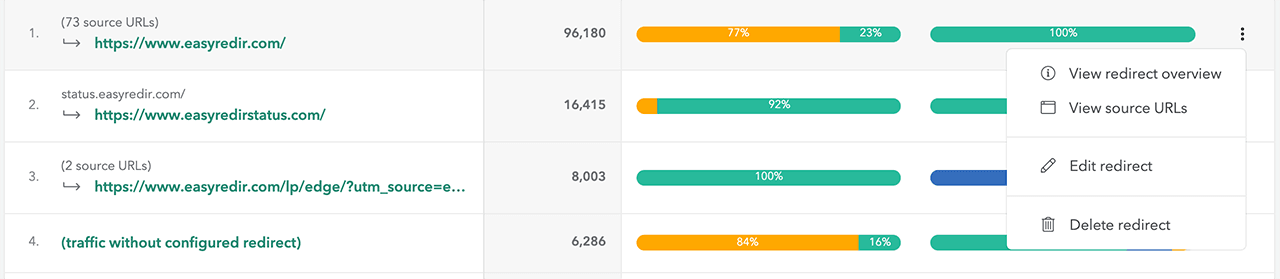
When you’ve gained some insightful feedback from your redirects and you want to make some changes, EasyRedir’s analytics allows for a seamless transition between understanding your redirect traffic and taking action. By clicking on the ellipsis menu next to each redirect metrics, you can choose to view its overview, view the source URL, edit or delete the redirect. This feature ensures that you’re able to quickly make changes based on the newly uncovered information.
Regardless of whether you are a casual or power user, EasyRedir’s URL redirect analytics offers valuable analytical data that can be easily viewed, understood and actioned!
We are also working on two additional features, along with email reporting and we can’t wait to share these with you soon!
Detailed analytics is available on currently offered Business plans and higher.